MMI Central

MMI Central 2Q09
Wednesday, April 1, 2009
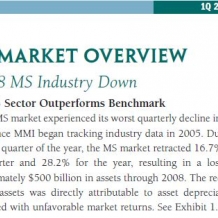
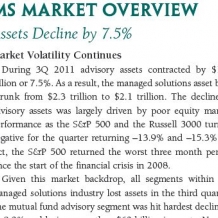
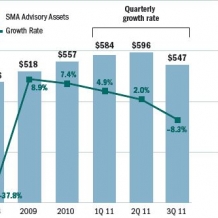
During the first quarter of 2009, the MS market slipped 6.1%. In comparison, the S&P 500 was off 11% for the same period.

MMI Central 1Q09
Thursday, January 1, 2009
The MS market experienced its worst quarterly decline in 4Q 2008 since MMI began tracking industry data in 2005.

MMI Central 4Q10 Final
Wednesday, September 1, 2010
During 3Q 2010, the MS industry posted $1.97 trillion in AUM, surpassing its previous high of $1.8 trillion which had been achieved during the second quarter of this year.

MMI Central 4Q10 Early Release
Wednesday, September 1, 2010
This is the second issue of Central – Early Release. The purpose of the early release is to help MMI member firms more quickly assess industry trends.

MMI Central 3Q10 Final
Sunday, August 1, 2010
The U.S. equity market suffered a significant decline, as the S&P 500 Index fell 11.4% for the second quarter 2010, breaking a string of four consecutive positive return quarters.

MMI Central 3Q10 Early Release
Sunday, August 1, 2010
Beginning with the third quarter 2010, the Money Management Institute (MMI) will distribute preliminary quarterly results.

MMI Central 2Q10
Thursday, April 1, 2010
MS asset levels have fully rebounded to pre-crisis asset levels. The MS industry now stands at $1.8 trillion in AUM, the highest level since MMI began tracking assets in 2006.

MMI Central 1Q10
Friday, January 1, 2010
The managed solutions segment (MS) was up 7.0% for the quarter edging out the S&P 500 index which realized a 6.0% return during the same time period.

MMI Central 4Q11 Final
Thursday, September 1, 2011
During 3Q 2011 advisory assets contracted by $177 billion or 7.5%. As a result, the managed solutions asset base shrunk from $2.3 trillion to $2.1 trillion.

MMI Central 4Q11 Early Release
Thursday, September 1, 2011
During 3Q 2011 advisory assets contracted by $177 billion or 7.5%. As a result, the managed solutions asset base shrunk from $2.3 trillion to $2.1 trillion.

Pages